

While WA-Research carries on its work to improve the Dgroups platform and make better and more detailed statistics on groups usage and membership for individual groups, we recently received some updates in terms of overall Dgroups headline figures.
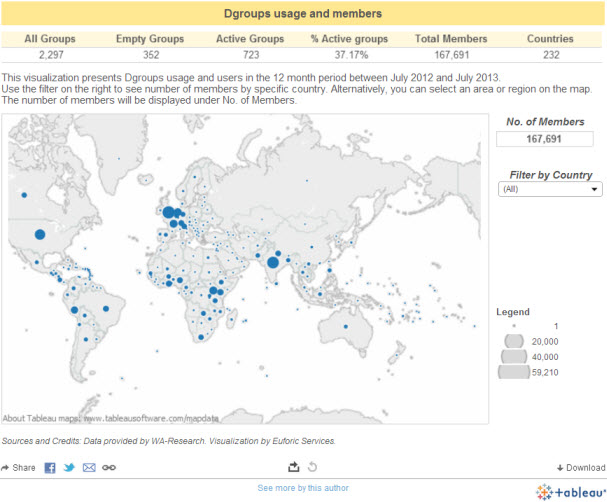
We have been using these data and presented them in a live, interactive visualization using Tableu Public. You can see it at this link and inquire it directly. The image below is a screenshot taken for the live visualization.
As you can see, Dgroups users at large form a truly global community of 167, 691 users across 232 countries and territories. Almost 2300 groups have been created on the platform to-date. Many of these groups were designed for a specific time-bound purpose and have fulfilled their function. The platform currently hosts 723 active groups, – where ‘active’ is considered a group that has recorded at least one message in the previous 365 days period – equivalent to almost 40 groups for each Full Dgroups Partner.
It is also interesting to look at the distribution of Dgroups members across regions and languages. Unfortunately data here are not complete – every Dgroups admin knows that it’s not always easy to get members to fill in their profile online – and indeed around one third of users have not indicated any country of residence.
However, it is very important to see that, amongst Dgroups users that have filled in their profile, the majority are located in Africa. Even if not surprising, as we know from previous data the the great part of email exchanges on Dgroups happens within the African continent, this is a further confirmation of the role that Dgroups plays in facilitating the access to development conversations online.